
Back in February we took the decision that a bike computer would be a useful addition to our set up as we were having a hard time guessing how fast we were going and thus how long it would take to get somewhere. At one point we were pacing ourselves with passing mopeds and asking the drivers what speed they were going. The computer would also allow us to record our distances covered, average speeds etc and Annie took a very diligent record of that.
Here are some of the, we think, interesting results:
(Since we only got the bike computer in February Vietnam and half of Cambodia, about 4 weeks and 1000km, are missing)

First up is our an overall chart showing the distance we cycled every day for the entire year. It varies a lot, but the average is just below 65km. We got our top day in the flat deserts of Turkmenistan when we needed to get across the country in 5 days.
Northern Iran and Armenia were pretty mountainous and we were not in a particular hurry during that leg of the trip so we were taking our time there. The spread of days is interesting and the biggest factor it shows up the terrain and road surface quality of the countries.

Next is the actual time we spent in the saddle each day. This came out surprisingly low, but we had quite a few short days and also we tend to stop and look around a lot…I think other cyclists, particularly solo cyclists, will spend longer in the saddle. But we tend to stop regularly. Lunch can also drag on a bit, sitting in our comfy chairs drinking tea and staring at the ants processing our crumbs.
Towards the end of our trip we had time to kill in Armenia and Turkey so that shows up here.
What I did think was that it is unsustainable to do 5hr + days for more than 3/4 days without one of us running our of steam and needing a long break. It is a lot of energy to burn up and a lot of food and sleep is needed to keep sustaining that level of effort for a longer period. I am sure it is possible, but we were also out to enjoy the scenery! By the end of the trip we used time on the bike to measure the ‘toughness’ of a day.

Everyone always asks how fast we go. Well here is our answer: 16km/hr.
We can tip along at 22/23km/hr on the flat and that is what the tandem is made to do – a slight downhill or flat with a tail wind and we can really get the momentum going. However going up hills at 4km/hr is not unheard of.
The other question we get asked it whether it is easier or harder on the tandem. We don’t know for sure since we haven’t done anything similar on two bikes, but we suspect the tandem is easier.
Top speed of the trip was 69km/hr. Vrooom!

Above is a graph of the distance covered in each country.
The information speaks for itself and is really a factor of how long we spent in each place and how long we could get on our visas. A rule of thumb often used is that to cycle tour 1000km will take approximately one month and that is pretty much true for us. We can do more for example in China we just couldn’t get enough of it and we covered 2600km in two months, but in Iran we spent a lot of time looking at stuff and meeting people so we did just 800km in a month.
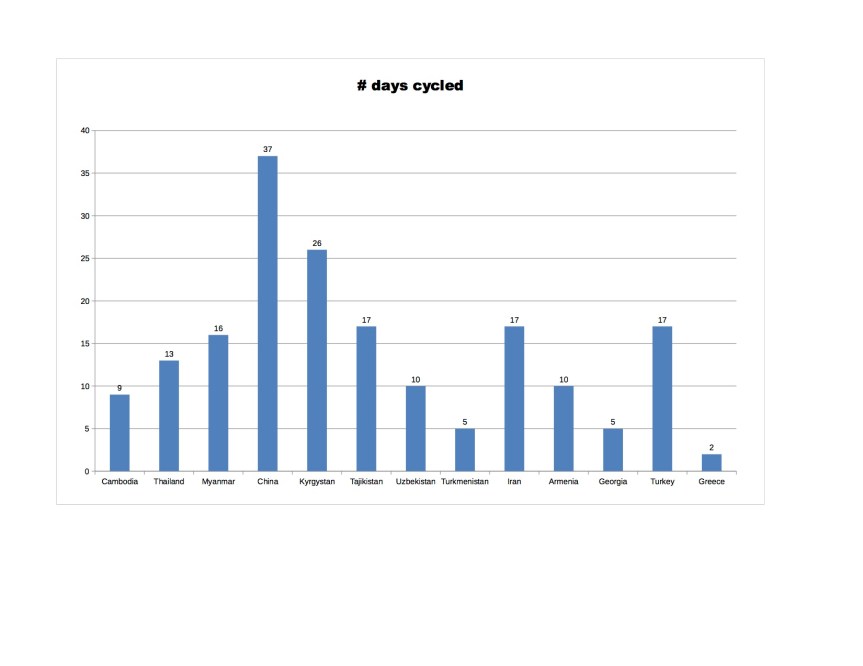
The days cycled in each country – this speaks for itself. The only country where we cycled every day on our visa was our mad dash across Turkmenistan. We planned our trip to cycle 4 out of 7 days each week and that roughly worked out to be what we did.
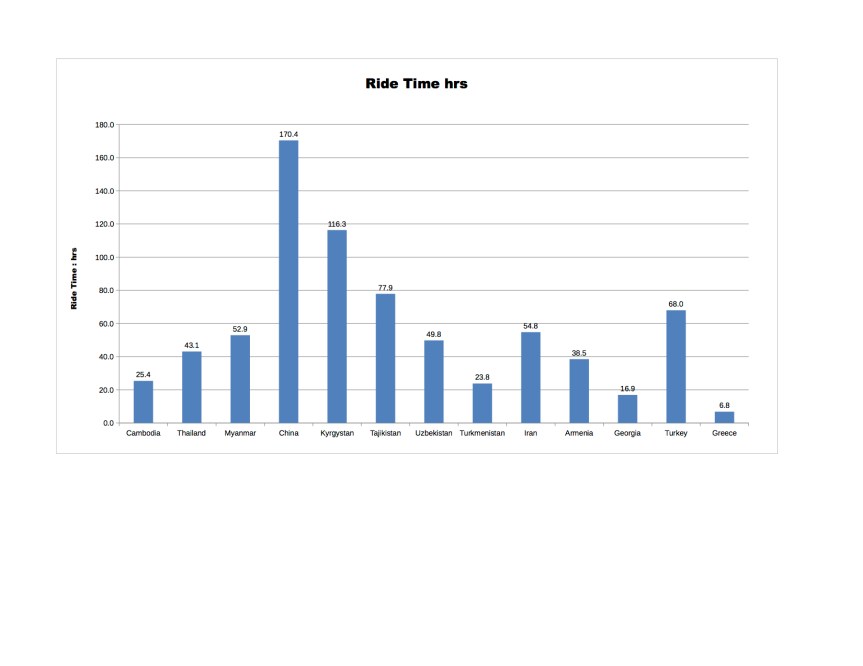
Lastly the ride time in each country. Our wheels saw a lot of China, Kyrgystan and Tajikistan and that was where the big mountains, big scenery and remote cultures were – no coincidence there! We realised early on we loved climbing big mountains and now that is what we go looking for on the map. Roll on the Alps!
